Showing posts with label Trends Technical Analysis. Show all posts

Wednesday, August 10, 2011

What Works for One Works for All

 You Have Not Seen Anything Yet.  Just Wait 'til I Take on the Stock Market!
SPY 2 Year, Weekly - 8.10.11 - Support Could Give Us a Lift.  But, the Next Step is Up for Grabs.
 SPY 20 Day, Hourly - 8.10.11 - Decline Continues
VIX/SPY Divergence Chart - VIX and SPY in Consolidation - Next Move Uncertain.

Thursday, August 4, 2011

Bear Revenge

 Hungry Bears are Dangerous
 SPY 20 Day, Hourly - 8.3.11 - Bounce into the Devil's Den - Relief Bounce but not yet showing Reversal
VIX SPY Divergence Study - Remains Bearish

Wednesday, August 3, 2011

Eight Days of Down!

 Windy on the Way Down
 Escalator Up - Elevator Down
VIX-SPY Divergence - Looking for a Reversal Signs

Saturday, July 30, 2011

Politics Trumps Technicals - "DC Square Dance"

 Market Awaits Political Compromise
SPY-VIX Digergence Chart - 20 Day, Hourly - 40 Day SMA - Interesting Crossovers may Confirm Reversal of Short Term (3-5 Day) Trend.

Thursday, July 7, 2011

Good Call to the Upside!

 "I Sleep Light"
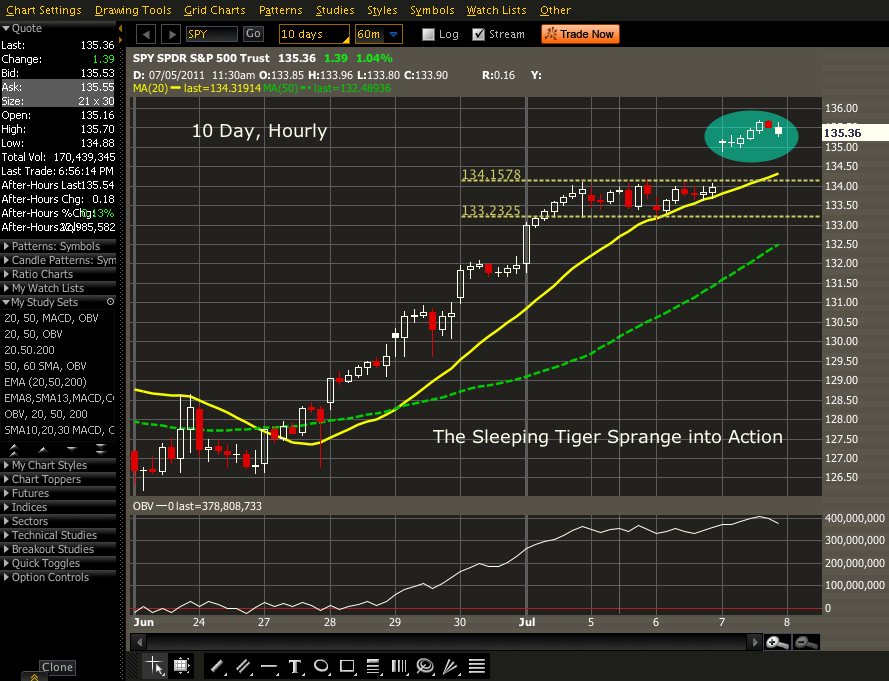
 SPY - 7.7.11 - Eight Days of Up calls for a Rest.
 SPY 6 Month, Daily - 7.7.11 - Big Gaps can also Leave Pot Holes for Retreat
SPY - 7.7.11 - The Sleeping Tiger woke up with a Vengeance.

Thursday, June 2, 2011

Sleeping Tiger in the Making (Consolidation)

 I Gotta Get My Rest to be Ready for the Sprint
 SPY 3 Day, 90 min. - 6.2.11 - Channel Trend is Down Short Term.  Price Action is in Consolidation Phase (Sideways).  Note the Horizontal Range Lines.  A Breakout will go One Way or the Other. 
SPY 2 Day, 15 min. - 6.2.11 - Sideways Consolidation between the Horizontal Lines.  Looking for a Breakout which will Happen at some Point.  Bias is Down as Price Action is Below the 50 Day MA. 

Thursday, May 26, 2011

"A Day Late but, Not a Dollar Short!"

 "Told Ya So!"
 SPY 30 Day - 5.26.11 - Check the MACD as it confirms the Reversals.  For the past couple of days the Sideways Consolidation has been recognized as a place from which a Breakout would occur.  Direction was not foreseen, but the Breakout was anticipated.  Today it happened to the Upside.  In addition the 50 Day Moving Average was traversed to the upside so it now becomes resistance,  A new swing to the upside is anticipated from here based on Technical patterns.
SPY 10 Day, Hourly - 5.26.11 - Breakout from a Sideways Channel Consolidation Pattern of the last 4 Days.  Moving Average Crossover suggests a new Movement to the Upside that could Sustain over a Day or Two (more is always possible).  Trend Channel remains to the Downside but short term the Price Action is Up.

Wednesday, May 18, 2011

Where Do We Go from Here?

 Ya Never Know What the Bulls Have Up Their Sleeves!
 SPY 30 Day, 90 minute - 5.17.11 - Short Term Trend Lines are Down.  The Market is Searching for Support.  This is a Critical Juncture as to a Bounce vs. Additional Breakdown.
SPY 10 Day, Hourly - 5.17.11 - A Closer View showing Trend Lines and Possible Support of Recent Market Lows.  The Question is, "Will it Hold?"

Thursday, April 28, 2011

Dollar Up in Smoke - Market on Fire!

 Debt Crisis and Demise of the Dollar Dominates the Scene
SPY 30 Day 2 Hour - 4.28.11 - There are Ups and Downs in the Market, but trading with the Trend has obvious advantages.  The "Trend", in fact, is the most important tool in the investor/trader toolbox.  It is so obvious and yet frequently disregarded.

Wednesday, April 27, 2011

This Market is Something to Crow About!

 Let's Hope I Don't Lay an Egg!
SPY 30 Day, 2 Hour - 4,27.11 - Trends are best analyzed on the longer term.  This chart is a 30 Day chart which is actually a 6 week period of time.  The Trend is UP.  Old Resistance becomes New Support.  Pull Backs to Support are Bought at Support preparing for the Next Leg UP.

Bullish Breakout Over Resistance!

 How about that?  Knocked down that fence like it wasn't even there!
SPY 20 Day, 2 Hour - 4.26.11 - Bullish Trend is "Back on Track."  Resistance should now be New Support.  The "S" factor is Bullish.

Sunday, April 24, 2011

Market at Resistance

 Resistance Looms Overhead
SPY 20 Day, 2 Hour - 4.21.11 - Large Gap Up Last Week Creates Questions on the Next Move.

Tuesday, March 15, 2011

Sunami Market!


 Roll with the Waves

SPY 20 Day, 2 Hour - 3.15.11 - Bottom of the Box Broke!  The Big Question now is Will the Market Rebound or Continue to Retreat?   There are Good Arguments for Both Cases.  Right now the market is driven by news related to Japan and Libya.  Neither has much to do with Fundamental Analysis or Technical Analysis.  It is more related to Emotional Analysis which is more difficult to factor.  This equates to "VOLATILITY."
 

Sunday, March 13, 2011

Waiting for the Box Top (or Bottom) to Pop

What are We Waiting For?

SPY 20 Day - 3.11.11 - Slight Breakout on the Bottom Side but Followed by Recovery.  This Leaves the Resolution Hanging.  Geo-political and Geological (earthquake) Issues Muddy the Water.

Thursday, February 17, 2011

Fire Storm on Wall Street!


The Bears have no Water


TO REPLAY TODAY MARKET ACTION COPY & PASTE THIS URL INTO YOUR BROWSER

http://gallery.me.com/peterballenger1#100281

Tuesday, February 8, 2011

Climbing the Moutntain!

The Market Ignores Negative Issues and Just Keeps Marching On!  Get in the Way, and You Can Get Hurt!

(CLICK IMAGE TO ENLARGE)
SPY 1 Day, 5 min. - 2.8.11 - Setup at the Open shows Regression Channel, Volume Profile, Bell Curve Projection (Golden Zone). and Active Trader.  Combine this information with Internals like TICKs & Breathe can provide Valuable Information on Subsequent Price Action.

 Breakout from Regression Channel at 9:15 Supported by TICKs and Active Trader Paved the Way to Higher Market Move.
SPY 1 Day, 5 min. - 2.8.11 - Early Breakout at 9:15 to the Upside Continued into the Close.  Price Action Exceeded the Golden Zone into New High Territory.  There was No Break in the Momentum during the Session.  From a Technical Perspective, this was a Perfect Day.

Sunday, February 6, 2011

The Devil is in the Details

Make a Move and I Gotcha!

CLICK ON IMAGES TO ENLARGE

SPY 20 Day, 2 Hour - 2.4.11 - Longer Term Trend continues UP!  But, note the divergence between the Price Action and the Longer Term "On Balance Volume."  This would suggest less Money Flow going to Support the Move.  In addition the Price Action is in the Upper Quadrant of the  Channel.  Could we be "Running out of Steam?"

SPY 2 Day, 5 min. - 2.4.11 - Friday's Price Action was Bullish with a move into a Higher "Value Area."  On Balance Volume was consistent with the move.  Yellow Lines depict Mondays "Value Area" High and Low.  Continued concerns about the Middle East just add potential Volatility to the Market making Direction Decisions more difficult.

Tuesday, February 1, 2011

The Market Roars Back!

Market is Powered Up for a Sprint in Spite of Middle East Concerns

(Bike courtesy of Dr. Elizabeth Riseling)

CLICK IMAGES TO ENLARGE

SPY 5 Day, 15 min. - 2.1.11 - The "Egyptian Dip" was Quickly Erased by a Rally Back to the Highs of the Channel Trend.  On Balance Volume and MACD were both On Board as were the AD Lines and UVOL/DVOL.  A Pause or Consolidation Rest would be Understandable after all this Action.


SPY 20 Day, Hourly - Bullish Trend Channel is Depicted.  The Line Depict One and Two Standard Deviations from the Mean.  This is a Linear Bell Curve and is Based on Statistical Probabilities (not artwork).

Monday, January 31, 2011

"Damn the Torpedoes, Full Speed Ahead!

Egypt is Egypt & the Market is the Market

CLICK IMAGE TO ENLARGE

SPY 20 Day, 2 Hour - 1.31.11 - World Affairs Aside, the Trend Continues UP!  Intermediate term the SPY is in in Mid-Stream.  The Green Line is the 20 Day Moving Average, Considered by Many as the Holy Grail.

SPY 5 Day, 15 min. - Bounce Off of Support with New Potato in Formation.  Those Pictures formed by the Moving Averages are the Potatoes.  All Down Potatoes Lead to Up Potatoes and All Down Potatoes Lead to Up Potatoes.  So the Secret is to Always be on the Right Side of the Potato.

SPY 2 Day, 15 min. - Contrary to the Conventional Wisdom that the Market does not Like Uncertainty, the Move Today was Bullish.  The Problems in Egypt and the Middle East have been Shrugged Off as Either Resolved or of Little Short Term Concern.  This May Still Come Back to Haunt Us.