Monday, June 14, 2010

Euro - DX Dance!

Who has the best Money?  Europe or USA?

Euro is Up so the DX is Down.

VIX (Volatility Index) - Down > Consistent with Bull Move.

SPY 20 Day, 2 Hour - Bull move with Fade at the Close.  This leaves questions as to Tomorrow.

Dancing around the 200 Day Moving Average - This is the Historical borderline between a Bull and a Bear Market.  Pull Back at the Close leaves Questions as to Momentum.

Sunday, June 13, 2010

Long Range View is Helpful!

Galileo had the Right Idea!

DX "Dixie" is in a Pull Back which is "Market Bullish" but it is Low in the Range.

VIX Trend is Down which is Bullish.

S&P Futures have a Bearish Trend with a recent Bull Move.  Price Action is "Butting Heads" with Resistance.  Where we go from here is anyone's guess.

Tuesday, June 8, 2010

Fragile Support in Market Indicators

Something doesn't feel right here!

VIX - Volatility Index - Higher than 30 implies fear and bearish tendency in market.
DX - "Dixie" - US Dollar Index on the rise - Negative implications for the market.
GS - Goldman Sachs - Downward trend - "As financials go, so goes the market."

SPY - S&P 500 - The trend is down.  There will be bounces, but all indications are that there will be more moves to the downside.

Monday, June 7, 2010

What Next? Bear Market, Bust, or Bounce!


f
Futures are "Red."  Indicates more move to the Downside!

Thursday, June 3, 2010

Volatility Prevails!

Crosscurrents in Economy & Politics Create Uncertainty & Volatility

Tuesday, June 1, 2010

EURO, BP, Gulf Oil Spill, Israeli Boat Boarding, Create Uncertainty

Slippery Sit-Com - Markets do not tolerate Uncertainty

US Dollar continues Uptrend vs. EURO
SPY in Down Trend - Very Weak at the Close on BP Criminal Probe by Attorney General.

SPY 10 Day, 1 Hour - Potato Trade - New Bear Potato in formation.  The last Bear Potato lasted Nine Days.  The brief Bull Potato never really got going.  Following the gap up there was just no follow through to the upside.  Basically there has been Twelve days of a Weak Market with no significant move by the Bulls.


"EUROsion" of Confidence

EURO down, Dollar up, Market down.

US Dollar Stronger as Europe faces Debt Crisis
The Recent Bullish Potato looks headed for the Compost Pile.
SPY Projected to Gap Down on Tuesday.  Note the OVAL.
SPY Rally Looks "Over and Done."

Thursday, May 27, 2010

The Bull is Back!

Here's hoping you didn't bite on the Bear Trap.

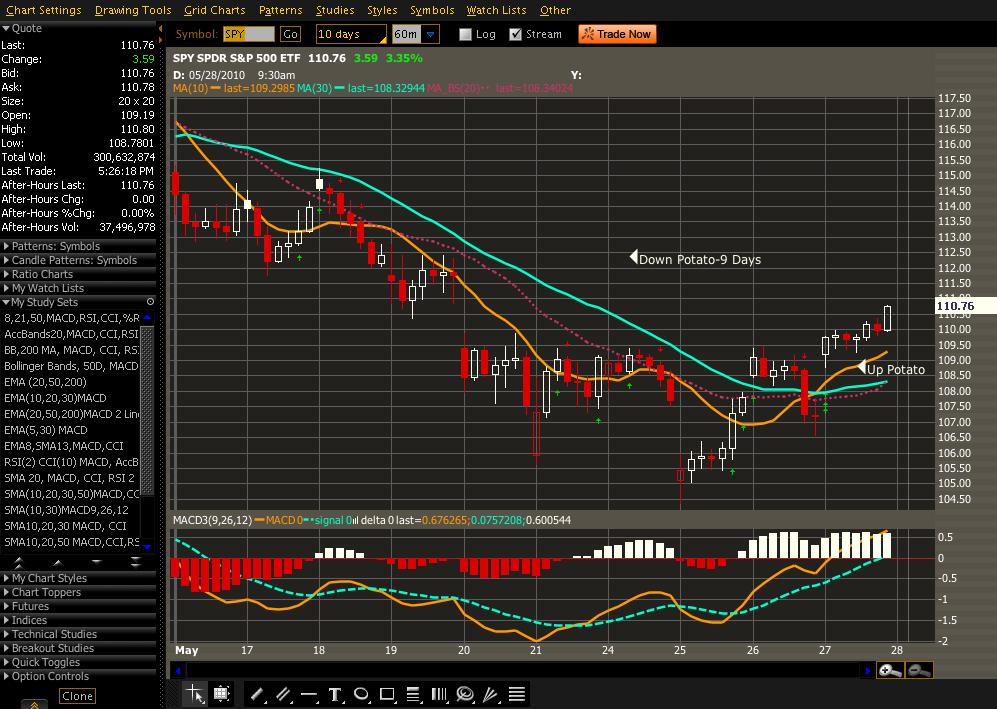
SPY 10 Day, Hourly - Bear Potato yields to the Bull after a 9 Day run.  Note how the Golden Line drove into the belly of the MACD at the same time as the MA Crossover.  This is a significant reversal signal.

The US Dollar opened strong but fell back as the EURO stabilized.

SPY 20 Day, Hourly - 5.27.10 - Reversal of fortune in the SPY chart.

Wednesday, May 26, 2010

Tricky Market Posture - "Head Fakes to Upside and Downside"

"Devil's Den" Situation - Trend in Transition - Calls for Caution

US Dollar continues to Rally off of EURO concerns.  Trend remains to Upside.
SPY 20 Day, 1 Hour - Trend is Down

Potato Chart - SPY 10 Day, 1 Hour - "Devil's Den" situation - Ambiguous transition from Down Potato to Up Potato.  Price Action on both sides of Moving Average Crossover.  The situation is not clear as to direction.  It could go either way.

Bounce vs. Reversal?

Whoa!  Can't you guys stick with the Trend?
(Click on any image to Enlarge)

US Dollar in Up Trend - Short Term Pull Back - Consistent Inverse Price Action as to the General Market

SPY 10D, Hourly - 5.25.10 - Eighth Day of Down Potato - Price Action in the "Devil's Den" - Potential "Reversal" to the Upside or Will it "Roll Over?"

SPY 5 Day, 15 min. - 5.25.10 - Bollinger Bands show Volatility - Bounce off the Lows with a Potential for Reversal - "Woodies CCI and RSI in "Overbought Territory".